AI-powered insights
Make time visible
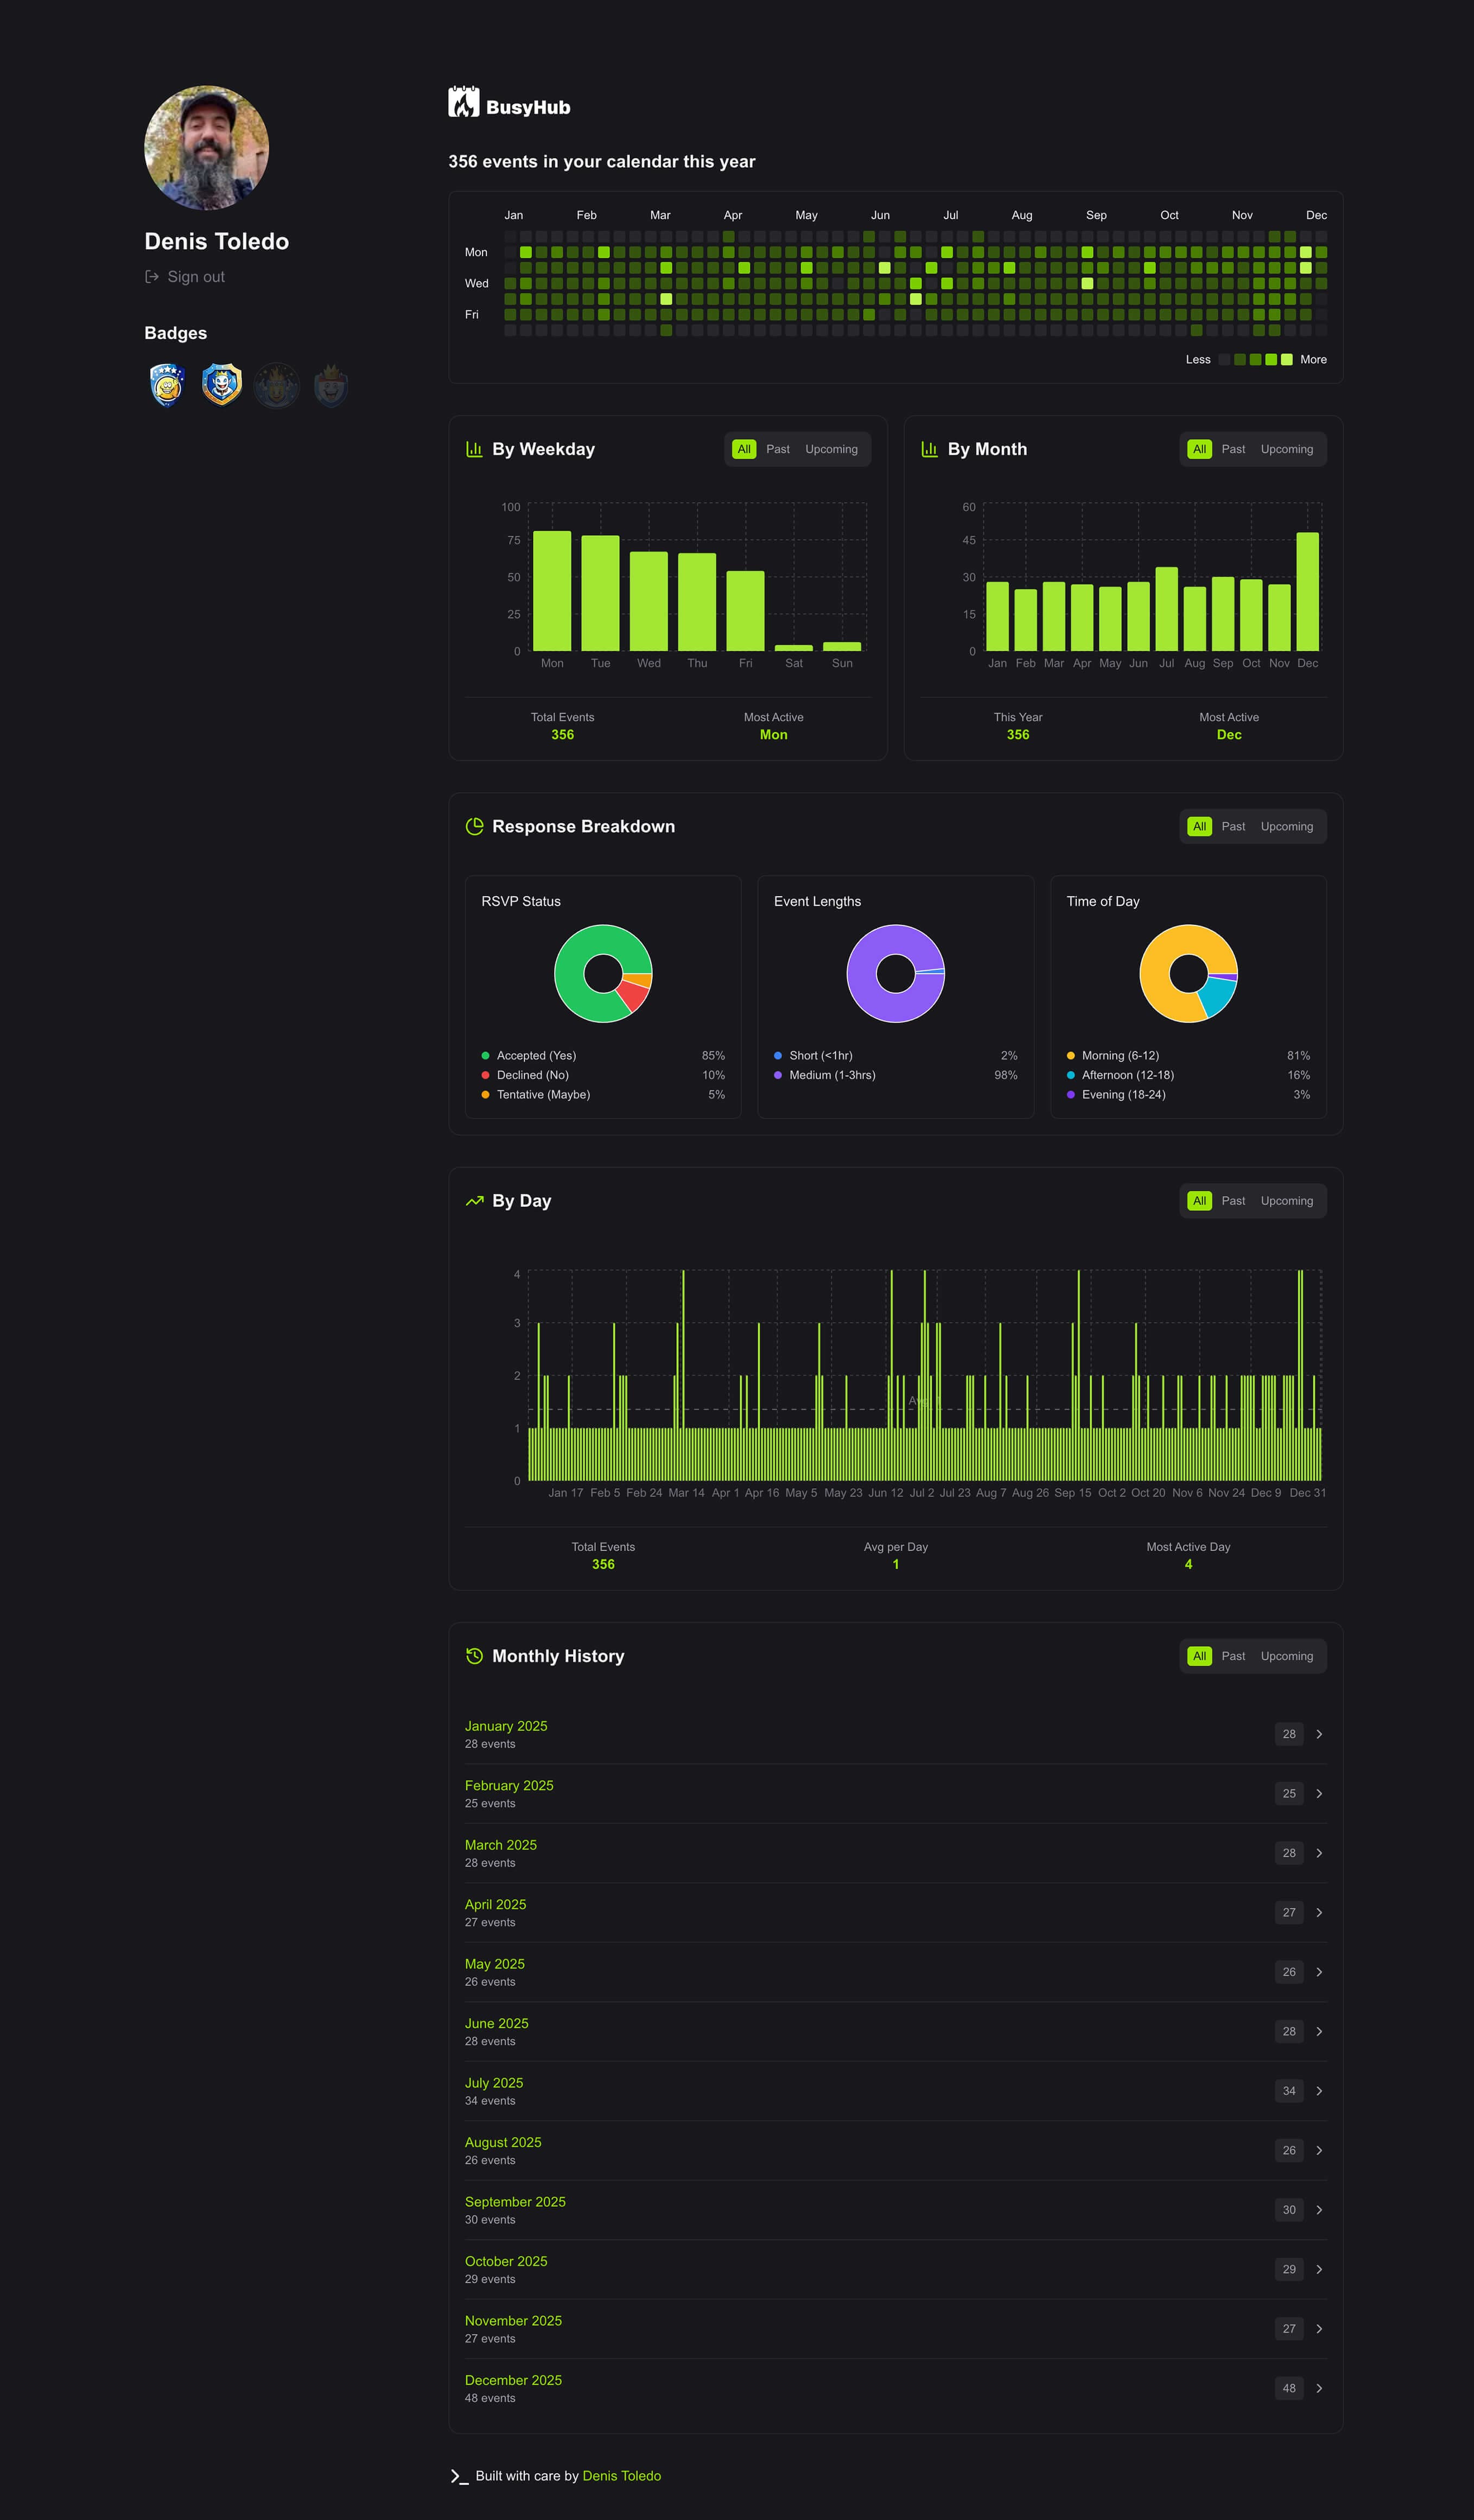
This is a visual heatmap showing a sample timeline of calendar activity. Lighter squares represent days with more events. This preview uses fictional data and is not interactive. Your actual calendar heatmap will appear here after connecting your Google Calendar.
Transform Google Calendar into
AI-driven productivity analytics
How it works
Get AI insights
AI analyzes your patterns to prevent burn-out, suggest schedule optimizations, and find your peak productive hours
See it in action
Trusted by busy professionals
Join professionals worldwide who've transformed their relationship with time using BusyHub's AI-powered insights